Energy consumption monitoring tutorial: Difference between revisions
No edit summary |
|||
| (22 intermediate revisions by 8 users not shown) | |||
| Line 1: | Line 1: | ||
{{Portal|User}} | |||
{{Portal|Tutorial}} | |||
{{TutorialHeader}} | |||
Estimate duration: 90 minutes | |||
<span id="introduction"></span> | |||
== Introduction == | |||
In | In this tutorial, you will learn how to monitor electrical energy consumption while experimenting on server-class machines under Grid’5000. | ||
The tutorial will be organized into the following sections: | |||
* Monitoring devices available | |||
* Find monitoring features available on a node | |||
* Getting metrics values from Kwollect | |||
* Monitoring of internal metrics (e.g. RAPL) | |||
* Advanced case: enable high-frequency monitoring on Wattmetres and other on-demand metrics | |||
* Advanced case: find energy consumption for individual power supply | |||
* Practical study | |||
The first four sections explain the basics of energy monitoring under Grid’5000 and should not be skipped. The two “Advanced” sections are optional. The “Practical study” is an exercise to put into practice what you have learned. | |||
= | <span id="monitoring-devices-available"></span> | ||
== | == Monitoring devices available == | ||
Grid’5000 provides access to various monitoring devices that measure the electrical power consumed by nodes, such as: | |||
<ul> | |||
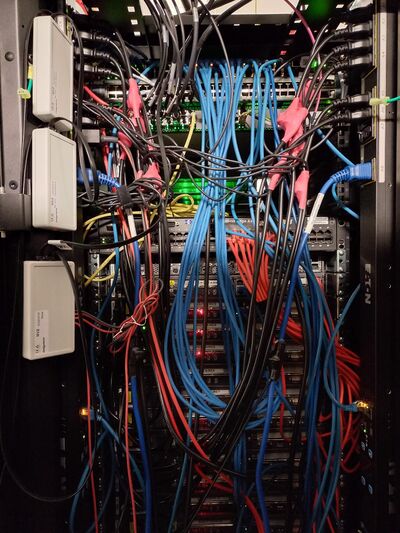
<li><p>“Wattmetres” which are specialized devices localized between a node power supply and its power source and able to perform up to 50 measurements per second, with a high relative precision.</p> | |||
<p>The current generation of Wattmetres installed on the infrastructure is made by [https://www.adecwatts.fr/Wattmetre-et-analyseur-de-reseau-bt/ ADECWatts company].</p> | |||
<center> | |||
<div class="figure"> | |||
[[File:Wattmv3-lyon.jpeg|400px|Wattmetres are located on the left side of the rack]] | |||
</div> | |||
<p>(Wattmetres are located on the left side of the rack)</p></li> | |||
</center> | |||
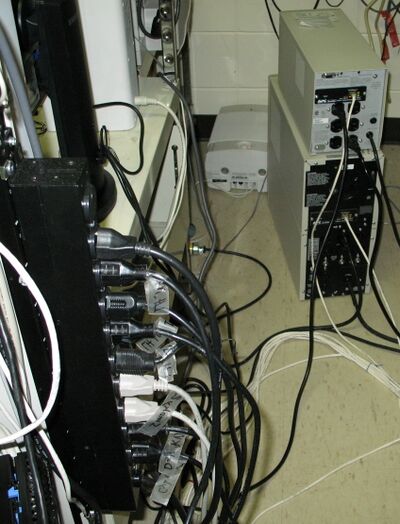
<li><p>PDU (Power Delivery Units), which are the most common way to deliver electrical power to server-class nodes used in Grid’5000, may also export energy monitoring metrics. However, they are less precise than Wattmetres.</p> | |||
<center> | |||
<div class="figure"> | |||
[[File:APC_10-outlet_rackmount_19-inch_PDU.jpg|400px|PDU on the left used to power servers]] | |||
</div> | |||
<p>(PDU on the left is used to power servers)</p></li> | |||
</center> | |||
<li><p>BMC (Baseboard Management Controller) are control units placed inside a server chassis, while remaining independent of the rest of the system. They also export energy monitoring metrics, but are even less precise than PDU and thus, Wattmetres (in particular, they are localized downstream from the power supply and therefore cannot take into account its energy losses).</p></li></ul> | |||
In addition, individual components inside a node may provide energy monitoring. This is typically the case for CPU and GPU, which provide energy consumed by various internal parts by exposing internal hardware counters accessible through a dedicated interface, such as RAPL for Intel & AMD CPUs and NVML for NVIDIA GPUs. See these references for more information: [https://hubblo-org.github.io/scaphandre-documentation/explanations/rapl-domains.html 1] [https://github.com/bpetit/awesome-energy 2] [https://developer.nvidia.com/management-library-nvml 3]. | |||
⚠️ Warning ⚠️: Monitoring metrics are not always reliable: the monitoring device may fail and report wrong values; PDU and BMC often report inaccurate values (e.g., updated at a low frequency, heavily smoothed, using a moving average, etc.). It is strongly recommended to cross-check your measurements by using different monitoring devices (e.g., both Wattmetres and BMC) to ensure confidence in results. | |||
<span id="find-monitoring-features-available-on-a-node."></span> | |||
== Find monitoring features available on a node. == | |||
Monitoring, like everything else on Grid’5000, is documented in the Grid’5000 Reference API. Let’s see how to query this API to discover what monitoring devices are available for a particular node. | |||
Monitoring capabilities are described in terms of ''metrics'' available on a cluster. To get the list of all metrics available for a cluster, the API can be queried at this address: | |||
<pre>https://api.grid5000.fr/stable/sites/<SITE>/clusters/<CLUSTER></pre> | |||
For instance, if you are interested in metrics available on taurus-12 node at Lyon, you can query the following URL: | |||
https://api.grid5000.fr/stable/sites/lyon/clusters/taurus | |||
Metrics are described under the <code>metrics</code> entry of the JSON document returned by the command. To get a better view of the metrics list, you can use a command such as: | |||
<pre>curl https://api.grid5000.fr/stable/sites/lyon/clusters/taurus | jq '.metrics' | less</pre> | |||
As you can see, many metrics are available, related to energy monitoring or not. More information about general monitoring in Grid’5000, including the full list of available metrics, is available in [https://www.grid5000.fr/w/Monitoring_Using_Kwollect Monitoring Using Kwollect] documentation. | |||
We will focus on two metrics for this tutorial: <code>wattmetre_power_watt</code> and <code>bmc_node_power_watt</code>. The Reference API description of these metrics looks like this: | |||
<syntaxhighlight lang="json">{ | |||
"description": "Power consumption of node reported by Wattmetre, in watt", | |||
"name": "wattmetre_power_watt", | |||
"optional_period": 20, | |||
"period": 1000, | |||
"source": { | |||
"protocol": "wattmetre" | |||
} | |||
}, | |||
{ | |||
"description": "Power consumption of node reported by BMC, in watt", | |||
"name": "bmc_node_power_watt", | |||
"period": 5000, | |||
"source": { | |||
"id": "1.3.6.1.4.1.674.10892.5.4.600.30.1.6.1.{{ 1.3.6.1.4.1.674.10892.5.4.600.30.1.8.1 == System Board Pwr Consumption }}", | |||
"protocol": "snmp" | |||
} | |||
}</syntaxhighlight> | |||
* The <code>description</code> field explains the nature of the monitoring devices, as well as the physical unit of the measure. | |||
* The <code>name</code> field is the metric’s identifier used throughout the monitoring system. | |||
* The <code>period</code> field describes the interval, in milliseconds, between two consecutive measurements performed on the monitoring device. (Note that this does not necessarily correspond to the frequency with which the device itself update its internal value. It can be larger, especially on BMC, as said in the Warning section above). | |||
* The <code>optional_period</code> field, only available on the <code>wattmetre_power_watt</code> metric, indicates that this device can be configured to perform even more frequent measurements every 20 ms (i.e., at 50 Hz), on user’s demand (more on that later). | |||
* The <code>source</code> field indicates the protocol used to query the monitoring device and should not be of much interest to you. | |||
<span id="getting-metrics-values-from-kwollect"></span> | |||
== Getting metrics values from Kwollect == | |||
Once you have identified the nodes and the metrics you are interested in, you can simply query Kwollect, the monitoring system used in Grid’5000, to retrieve metrics values over time. For instance, to get <code>wattmetre_power_watt</code> and <code>bmc_node_power_watt</code> metrics values for <code>taurus-4</code> and <code>taurus-5</code> between 10:00 and 10:10 the 1st of May 2025, you can query the API at: | |||
https://api.grid5000.fr/stable/sites/lyon/metrics?nodes=taurus-4,taurus-5&metrics=wattmetre_power_watt,bmc_node_power_watt&start_time=2025-05-01T10:00&end_time=2025-05-01T10:10 | |||
This will return a JSON document like: | |||
<syntaxhighlight lang="json">[{"timestamp":"2025-05-01T10:00:00+02:00","device_id":"taurus-5","metric_id":"wattmetre_power_watt","value":6.052631578947369,"labels":{"_device_orig": ["wattmetre1-port4"]}}, | |||
{"timestamp":"2025-05-01T10:00:00+02:00","device_id":"taurus-4","metric_id":"wattmetre_power_watt","value":6.332432432432432,"labels":{"_device_orig": ["wattmetre1-port3"]}}, | |||
{"timestamp":"2025-05-01T10:00:00.654002+02:00","device_id":"taurus-5","metric_id":"bmc_node_power_watt","value":0,"labels":{}}, | |||
{"timestamp":"2025-05-01T10:00:00.654322+02:00","device_id":"taurus-4","metric_id":"bmc_node_power_watt","value":0,"labels":{}}, | |||
{"timestamp":"2025-05-01T10:00:01+02:00","device_id":"taurus-4","metric_id":"wattmetre_power_watt","value":6.070731707317074,"labels":{"_device_orig": ["wattmetre1-port3"]}}, | |||
{"timestamp":"2025-05-01T10:00:01+02:00","device_id":"taurus-5","metric_id":"wattmetre_power_watt","value":6.239024390243902,"labels":{"_device_orig": ["wattmetre1-port4"]}}, | |||
...</syntaxhighlight> | |||
where each line corresponds to a single measurement. | |||
It is also possible to get all metrics associated to a Grid’5000 reservation by providing OAR job number: | |||
https://api.grid5000.fr/stable/sites/lyon/metrics?job_id=1899135 | |||
This will return all metrics from all nodes belonging to the reservation, but you can filter by using the <code>nodes</code> and <code>metrics</code> parameters. | |||
A graphical dashboard is also available to visualize metrics. It is available at: | |||
https://api.grid5000.fr/stable/sites/lyon/metrics/dashboard | |||
You can change <code>lyon</code> with the site you need. | |||
It can be noted that metrics stored in Kwollect are kept indefinitely. | |||
<span id="monitoring-of-internal-metrics"></span> | |||
== Monitoring of internal metrics == | |||
We call “internal metrics” the metrics available from inside the node operating system, i.e., that you can fetch yourself as a user, unlike metrics fetched from external devices, such as Wattmetres, provided by the infrastructure. This kind of metrics includes RAPL for CPU energy consumption, NVML form GPU consumption, but also any kind of metrics available from the system, such CPU or IO usage. | |||
As many tools are available to get internal metrics, we assume that you will want to use the one that’s best fit your needs. We will explain a generic way to push metrics to Kwollect, so it can be adapted whatever the tool used. We will also introduce [https://alumet.dev/ Alumet] usage, a convenient tool to fetch internal metrics which has a “native” Kwollect export feature. | |||
In any case, you will be able to access all your metrics, both internal and external from devices such as Wattmetres and BMC, through the same API using Kwollect. | |||
<span id="pushing-metrics-to-kwollect"></span> | |||
=== Pushing metrics to Kwollect === | |||
It is possible to push metrics to Kwollect, from inside a node, by performing a POST request to following API endpoint: | |||
<pre>https://api.grid5000.fr/stable/sites/SITE/metrics</pre> | |||
The request must include the list of metrics to be inserted, formatted as a JSON like: | |||
<syntaxhighlight lang="json">[{"metric_id": "METRIC_NAME1", "value": VALUE1}, {"metric_id": "METRIC_NAME2", "value": VALUE2}, …]</syntaxhighlight> | |||
For each metric, a <code>timestamp</code> value can optionally be provided (otherwise, the current time will be used as the metric’s timestamp). The <code>device_id</code> field can also be given (if it corresponds to a node under reservation by the user making the request), otherwise, the node from which the request originates will be used. Finally, a <code>labels</code> field can be added to provide arbitrary metadata formatted as JSON. | |||
As an example, this little shell script shows how to use this feature from a reserved node. Each second, it will fetch the energy consumed by CPU cores from RAPL using “Linux Perf” tool and push the resulting values to Kwollect: | |||
<syntaxhighlight lang="bash">while true; do | |||
echo "Fetching power consumption by CPU cores using RAPL" | |||
V=$(sudo-g5k perf stat -e power/energy-cores/ -x"," sleep 1 2>&1 | grep Joules | cut -d',' -f1) | |||
echo "Average power during last second: $V W, pushing to Kwollect" | |||
curl https://api.grid5000.fr/stable/sites/lyon/metrics -X POST -H 'content-type: application/json' -d '{"metric_id": "my_cores_power_watt", "value": '$V'}' | |||
sleep 1 | |||
done</syntaxhighlight> | |||
The <code>my_cores_power_watt</code> metric values will be available as usual from Kwollect, e.g., by requesting at: | |||
<pre>https://api.grid5000.fr/stable/sites/lyon/metrics?job_id=MY_JOB_ID,metrics=my_cores_power_watt</pre> | |||
<span id="using-alumet-adaptive-lightweight-unified-metrics"></span> | |||
=== Using Alumet (Adaptive, Lightweight, Unified Metrics) === | |||
[https://alumet.dev/ Alumet] is a versatile monitoring tool that provides a generic measurement pipeline with three steps: poll measurement sources, transform the data, and write the result. It is designed to be able to ingest metrics from various sources without redundant work. Supported sources include RAPL domains, Nvidia’s NVML, and Jetson INA sensors. | |||
Alumet can be configured to monitor internal metrics of a Grid’5000 and export them to Kwollect using the “push feature” described above. | |||
We are going to present an example of this joint use of Alumet and Kwollect for energy monitoring: Alumet is used to monitor RAPL metrics and exports them to Kwollect. Then, you will be able, by querying Kwollect API, to compare measurements from RAPL to external monitoring devices provided by Wattmetres and BMC. | |||
First, Alumet needs to be installed on the reserved Grid’5000 node. Kwolllect support currently requires the latest Git version, to make things easier, the binary is available under Grid’5000 at: <code>http://public.lyon.grid5000.fr/~sdelamare/alumet-agent</code>. You can execute the following commands to get Alumet: | |||
<syntaxhighlight lang="bash">wget http://public.lyon.grid5000.fr/~sdelamare/alumet-agent | |||
chmod +x alumet-agent</syntaxhighlight> | |||
Then, we will use a <code>alumet-config.toml</code> configuration file to setup the ''rapl'' input plugin and the ''kwollect-output'' plugin with the following content: | |||
== | <pre class="toml">[plugins.rapl] | ||
poll_interval = "1s" | |||
flush_interval = "5s" | |||
no_perf_events = false | |||
[plugins.kwollect-output] | |||
url = "https://api.grid5000.fr/stable/sites/SITE/metrics" | |||
append_unit_to_metric_name = true | |||
use_unit_display_name = false</pre> | |||
Remind replacing <code>SITE</code> in the URL entry by the site where your reserved node is located. | |||
To access to RAPL metrics, we need a privileged configuration that must be setup using: | |||
<pre>sudo-g5k | |||
sudo sysctl -w kernel.perf_event_paranoid=0</pre> | |||
Finally, run Alumet with: | |||
<pre>./alumet-agent --config alumet-config.toml --plugins rapl,kwollect-output run</pre> | |||
As specified in the configuration file, this will fetch RAPL metrics every second and push them to Kwollect. | |||
The name of the RAPL metrics used by Alumet is “rapl_consumed_energy_J” (RAPL indeed performs energy measurements and the units used are Joules). You can look at these metrics by querying: | |||
https://api.grid5000.fr/stable/sites/lyon/metrics?nodes=taurus-11&metrics=rapl_consumed_energy_J&start_time=2025-07-03T12:15 | |||
( | (replace <code>lyon</code>, <code>taurus-11</code> by what is appropriate for you. If <code>start_time</code> is omitted, the metrics from last 5 minutes will be returned). | ||
A single metric looks like this: | |||
<syntaxhighlight lang="json">{ | |||
"timestamp": "2025-07-03T12:19:59.846832+02:00", | |||
"device_id": "taurus-11", | |||
"metric_id": "rapl_consumed_energy_J", | |||
"value": 0.87835693359375, | |||
"labels": { | |||
"domain": "pp0", | |||
"consumer_id": "", | |||
"_insert_user": "sdelamare", | |||
"ressource_id": "0", | |||
"__insert_time": 1751538003.850289, | |||
"consumer_kind": "local_machine", | |||
"ressource_kind": "cpu_package" | |||
} | |||
}</syntaxhighlight> | |||
Pay attention to <code>labels</code> content. It provides information about the specific [https://hubblo-org.github.io/scaphandre-documentation/explanations/rapl-domains.html RAPL domain] associated to this particular measurement. In this case, the <code>"domain": "pp0"</code> entry means that this measure is the energy consumed by CPU’s cores and <code>"ressource_id": "0"</code> means that it only applies to the first CPU of the node. | |||
Finally, to get metrics from both external monitoring devices and RAPL, you can perform a query such as: | |||
https://api.grid5000.fr/stable/sites/lyon/metrics?nodes=taurus-11&metrics=wattmetre_power_watt,bmc_node_power_watt,rapl_consumed_energy_J&start_time=2025-07-03T12:15 | |||
But take care when comparing measures from RAPL and from Wattmetre or BMC: - RAPL measurements only concern a specific component of the system (CPU, DRAM, etc.), except for the “PSys” domain, which should encompass the whole system but which is loosely specified and only available on some recent hardware - The measurements from Wattmetres and BMC are power measurements, representing an average power usage over a period of time (one second by default for Wattmetres). The RAPL measurement reported by Alumet represents the total energy consumption during the period of time between the previous measurement and the current one. Remember that one Joule of energy is corresponding to a power usage of one Watt during one second. | |||
It can be noted that Alumet provides other modules to get consumption from GPU using NVML or from NVIDIA Jetson, and for other kind of metrics (CPU usage…) | |||
<span id="advanced-case-enable-high-frequency-monitoring-on-wattmetres-and-others-on-demand-metrics"></span> | |||
== Advanced case: Enable high-frequency monitoring on Wattmetres and others on-demand metrics == | |||
Some metrics are not monitored by default, or at a lower frequency. Let’s go back to the metrics description in the Reference API: | |||
<pre>curl https://api.grid5000.fr/stable/sites/lyon/clusters/taurus | jq '.metrics' | less</pre> | |||
<syntaxhighlight lang="json">{ | |||
"description": "Power consumption of node reported by Wattmetre, in watt", | |||
"name": "wattmetre_power_watt", | |||
"optional_period": 20, | |||
"period": 1000, | |||
"source": { | |||
"protocol": "wattmetre" | |||
} | |||
}, | |||
{ | |||
"description": "Power consumption of node reported by BMC, in watt", | |||
"name": "bmc_node_power_watt", | |||
"period": 5000, | |||
"source": { | |||
"id": "1.3.6.1.4.1.674.10892.5.4.600.30.1.6.1.{{ 1.3.6.1.4.1.674.10892.5.4.600.30.1.8.1 == System Board Pwr Consumption }}", | |||
"protocol": "snmp" | |||
} | |||
}, | |||
{ | |||
"description": "Voltage of PSU 1 reported by BMC, in volt", | |||
"labels": { | |||
"psu": "1" | |||
}, | |||
"name": "bmc_psu_voltage_volt", | |||
"optional_period": 5000, | |||
"period": 0, | |||
"source": { | |||
"id": "1.3.6.1.4.1.674.10892.5.4.600.12.1.16.1.1", | |||
"protocol": "snmp" | |||
} | |||
}, | |||
{ | |||
"description": "Current of PSU 1 reported by BMC, in amp", | |||
"labels": { | |||
"psu": "1" | |||
}, | |||
"name": "bmc_psu_current_amp", | |||
"optional_period": 5000, | |||
"period": 0, | |||
"scale_factor": 0.1, | |||
"source": { | |||
"id": "1.3.6.1.4.1.674.10892.5.4.600.30.1.6.1.{{ 1.3.6.1.4.1.674.10892.5.4.600.30.1.8.1 == PS1 Current 1 }}", | |||
"protocol": "snmp" | |||
} | |||
},</syntaxhighlight> | |||
The presence of an <code>optional_period</code> field indicates that the associated metrics can be activated “on demand”. For the <code>wattmetre_power_watt</code> metric, the <code>period</code> field is <code>1000</code> meaning that by default the Wattmetre gets a measure every second. However, as the <code>optional_period</code> is <code>20</code>, measurements are performed every 20 milliseconds when the metric is “on-demand” activated. Metrics having a <code>period</code> of <code>0</code>, such as <code>bmc_psu_current_amp</code>, don’t perform any measurement by default. It needs to be activated to perform measurements every <code>optional_period</code> milliseconds (i.e., every 5 seconds in the case of <code>bmc_psu_current_amp</code> metric). | |||
= | Enabling <code>on_demand</code> metrics must be done at reservation time, by providing <code>-t monitor=xxxx</code> option to <code>oarsub</code>. For instance, to enable <code>wattmetre_power_watt</code> high frequency monitoring: | ||
<pre>oarsub -r now -p taurus -t monitor='wattmetre_power_watt'</pre> | |||
To enable monitoring of <code>bmc_psu_current_amp</code>: | |||
< | |||
= | <pre>oarsub -r now -p taurus -t monitor='bmc_psu_current_amp'</pre> | ||
The <code>-t monitor</code> option accepts regular expressions matching metrics name. For example, you can enable all “on-demand” metrics using: | |||
<pre>oarsub -r now -p taurus -t monitor='.*'</pre> | |||
If you look at metrics at | |||
* | |||
<pre>https://api.grid5000.fr/stable/sites/lyon/metrics?job_id=MY_JOB_ID</pre> | |||
you will see more metrics than before, especially from Wattmetres. | |||
<span id="advanced-case-find-energy-consumption-for-individual-power-supply"></span> | |||
== Advanced case: find energy consumption for individual power supply == | |||
Most Grid’5000 nodes have several PSU to power them and several monitoring devices -one per PSU- are needed to monitor the power used by the entire node. They are some situations where you need to get metrics associated with each PSU separately and process them yourself. The two most common situations are: | |||
* Get power consumption from PDU: when Wattmetres are used, measurements on each Wattmetre are summed-up to provide the ''wattmetre_power_watt'' metric available on the node. But this automatic sum cannot be done for PDUs power values and metrics must be retrieved from each PDU delivering power to node PSUs. | |||
* Get power consumption for nodes sharing the same blade: Some Grid’5000 nodes are physically organized in groups of 2 or 4 that share the same server frame or ''blade''. PSUs belong to the blade and are therefore shared by the nodes grouped in the same blade. It would make no sense to provide a power consumption metric associated with a single node from these shared PSUs. | |||
In such cases, where monitoring of PSUs is available but no meaningful power consumption metric can be associated with an individual node, it may be still interesting to get metrics associated with each PSU separately and process them yourself. | |||
For instance, ''chuc'' cluster at Lille is composed of blades with two nodes each. Thus, <code>chuc-1</code> and <code>chuc-2</code> share the same PSUs, as well as <code>chuc-3</code> and <code>chuc-4</code>, etc. | |||
< | To retrieve the Wattmetres connected to these PDUs, it is possible to query the reference API for the specific node your interested in. For example, for <code>chuc-3</code>: | ||
https://api.grid5000.fr/stable/sites/lille/clusters/chuc/nodes/chuc-3 | |||
Under the <code>pdu</code> entry, you will find 6 “wattmetre” entries, meaning that <code>chuc-3</code> uses 6 PSUs monitored by Wattmetres. For each Wattmetre, the <code>uid</code> and <code>port</code> inform you about the Wattmetre device identifier that monitors each PSU. | |||
( | <syntaxhighlight lang="json">"pdu": [ | ||
--> | (...) | ||
{ | |||
"kind": "wattmetre-only", | |||
"port": 12, | |||
"uid": "wattmetrev3-1" | |||
}, | |||
{ | |||
"kind": "wattmetre-only", | |||
"port": 13, | |||
"uid": "wattmetrev3-1" | |||
}, | |||
{ | |||
"kind": "wattmetre-only", | |||
"port": 14, | |||
"uid": "wattmetrev3-1" | |||
}, | |||
{ | |||
"kind": "wattmetre-only", | |||
"port": 15, | |||
"uid": "wattmetrev3-1" | |||
}, | |||
{ | |||
"kind": "wattmetre-only", | |||
"port": 16, | |||
"uid": "wattmetrev3-1" | |||
}, | |||
{ | |||
"kind": "wattmetre-only", | |||
"port": 17, | |||
"uid": "wattmetrev3-1" | |||
} | |||
]</syntaxhighlight> | |||
You can check that <code>chuc-4</code> has exactly the same identifiers at: | |||
https://api.grid5000.fr/stable/sites/lille/clusters/chuc/nodes/chuc-4 | |||
which means that Wattmetres (and PSUs) are shared between these two nodes. | |||
Finally, you can retrieve values for all Wattmetres attached to <code>chuc-3</code> and <code>chuc-4</code> PSUs by querying the Wattemetre identifier they are connected to. For instance, the first Wattmetre has a <code>port</code> equals to <code>12</code> and its <code>uid</code> is <code>wattmetrev3-1</code>. This means that the corresponding Wattmetre identifier is <code>wattmetrev3-1-port12</code>. | |||
It is thus possible to retrieve the power consumption of every PSUs of <code>chuc-3</code> and <code>chuc-4</code> blade using a query that looks like: | |||
https://api.grid5000.fr/stable/sites/lille/metrics?devices=wattmetrev3-1-port12,wattmetrev3-1-port13,wattmetrev3-1-port14,wattmetrev3-1-port15,wattmetrev3-1-port16,wattmetrev3-1-port17 | |||
<span | The <code>devices</code> parameter has the same effect as <code>nodes</code> parameter seen before. | ||
<span id="practical-study"></span> | |||
== Practical study == | |||
We now invite you to do a practical exercise to apply what you’ve learned. It consists in a study of the energy cost of a matrix multiplication made with Pytorch. | |||
Reserve a node on Grid’5000 and execute the following commands to set up your environment: | |||
<pre>python -m venv monitoring_venv | |||
source monitoring_venv/bin/activate | |||
module load cuda | |||
pip3 install torch requests matplotlib | |||
export REQUESTS_CA_BUNDLE=/etc/ssl/certs/ca-certificates.crt</pre> | |||
< | Copy / paste this code snippet into a <code>monitoring_tutorial.py</code>. | ||
< | |||
=== | <span class="mw-customtoggle-1" style="color:#0000ff">Click to expand!</span> | ||
<div class="mw-collapsible mw-collapsed" id="mw-customcollapsible-1"> | |||
<syntaxhighlight lang="python"> | |||
import torch | |||
import time | |||
import socket | |||
import requests | |||
import matplotlib.pyplot as plt | |||
def main(): | |||
results = {} | |||
num_threads = [1, 2, 4, 8, 16, 32] | |||
for c in num_threads: | |||
start_time, end_time, duration, _ = perform_matrix_multiplication(num_threads=c) | |||
results[c] = {} | |||
results[c]["duration"] = duration | |||
values = get_metrics_from_kwollect(start_time=start_time, end_time=end_time, metric="wattmetre_power_watt") | |||
results[c]["energy_wattmetre"] = get_energy_from_metrics(values, duration) | |||
=== | values = get_metrics_from_kwollect(start_time=start_time, end_time=end_time, metric="bmc_node_power_watt") | ||
results[c]["energy_bmc"] = get_energy_from_metrics(values, duration) | |||
plot_results(results, "monitoring_tutorial.png") | |||
def perform_matrix_multiplication(num_threads=None): | |||
if num_threads is not None: | |||
num_threads_init = torch.get_num_threads() | |||
torch.set_num_threads(num_threads) | |||
N=2048 | |||
A = torch.randn(N, N, device="cpu") | |||
B = torch.randn(N, N, device="cpu") | |||
count = 0 | |||
start_time = time.time() | |||
while time.time() - start_time < 10: | |||
C = A @ B | |||
count += 1 | |||
end_time = time.time() | |||
duration = (end_time - start_time)/count | |||
print(f"Matrix multiplaction duration: {duration} seconds ({count} multiplications performed)") | |||
if num_threads is not None: | |||
torch.set_num_threads(num_threads_init) | |||
return start_time, end_time, duration, count | |||
def plot_results(results, outfile): | |||
num_threads = sorted(results.keys()) | |||
fig, ax1 = plt.subplots(figsize=(8, 8)) | |||
ax1.set_title("Matrix Multiplication Duration & Energy") | |||
ax1.set_xlabel("Number of threads used") | |||
ax1.set_ylabel("Duration (seconds)", color="orange") | |||
ax1.bar(num_threads, [results[c]["duration"] for c in num_threads], color="orange") | |||
ax2 = ax1.twinx() | |||
ax2.set_ylabel("Energy (joules)") | |||
ax2.plot(num_threads, [results[c]["energy_wattmetre"] for c in num_threads], "+-", color="green", label="wattmetre") | |||
ax2.plot(num_threads, [results[c]["energy_bmc"] for c in num_threads], "+-", color="blue", label="BMC") | |||
ax2.legend() | |||
plt.savefig(outfile) | |||
def get_metrics_from_kwollect(start_time, end_time, metric, site=None, node=None): | |||
if node is None: | |||
node = socket.getfqdn().split(".")[0] | |||
if site is None: | |||
site = socket.getfqdn().split(".")[1] | |||
# | kwollect_url = f"https://api.grid5000.fr/stable/sites/{site}/..." #FIXME | ||
print(f"Requesting Kwollect at {kwollect_url}") | |||
metrics = requests.get(kwollect_url).json() | |||
return metrics | |||
def get_energy_from_metrics(power_metrics, duration): | |||
average_power = sum(-1)/len([-1]) #FIXME | |||
energy = average_power * 0 #FIXME | |||
return energy | |||
if __name__ == "__main__": | |||
main() | |||
</syntaxhighlight> | |||
</ | |||
</div> | </div> | ||
<br/> | <br/> | ||
The goal of the script is to measure duration and energy consumed when performing matrix multiplications while using a different number of threads. The script is composed as follows: | |||
* The <code>main()</code> function implements the script logic: looping over a number of threads, perform the matrix multiplication, get metrics from Kwollect and finally plot the results under “monitoring_tutorial.png” file. | |||
* The <code>perform_matrix_multiplication(num_threads)</code> function implements the matrix multiplication | |||
* The <code>plot_results(results, outfile)</code> function implements plotting of the results | |||
* The <code>get_metrics_from_kwollect(start_time, end_time, metric, site=None, node=None)</code> is used to fetch the values for <code>metric</code> between <code>start_time</code> and <code>stop_time</code> period. (if <code>node</code> and <code>site</code> parameters are not provided, they will be derived from the machine where the script is executed) | |||
* The <code>get_energy_from_metrics(power_metrics, duration)</code> will compute the energy consumed under <code>duration</code> from <code>power_metrics</code> received from Kwollect | |||
The latter two functions are incomplete. You must replace lines containing “FIXME” comments with the appropriate code to make the function work as expected. | |||
Once done, you can transfer the “monitoring_tutorial.png” file to your local machine to visualize it. You should be able to answer questions such as: | |||
* How many cores you should use to get the fastest matrix multiplication? | |||
* Is it more energy efficient to use less cores to consume less energy? | |||
* … | |||
=== Solution === | |||
Below are the completed functions that implement this exercise: | |||
<span class="mw-customtoggle-2" style="color:#0000ff">Click to expand!</span> | |||
<div class="mw-collapsible mw-collapsed" id="mw-customcollapsible-2"> | |||
<syntaxhighlight lang="python"> | |||
def get_metrics_from_kwollect(start_time, end_time, metric, site=None, node=None): | |||
if node is None: | |||
node = socket.getfqdn().split(".")[0] | |||
if site is None: | |||
site = socket.getfqdn().split(".")[1] | |||
kwollect_url = f"https://api.grid5000.fr/stable/sites/{site}/metrics?nodes={node}&start_time={start_time}&end_time={end_time}&metrics={metric}" | |||
print(f"Requesting Kwollect at {kwollect_url}") | |||
metrics = requests.get(kwollect_url).json() | |||
return metrics | |||
def get_energy_from_metrics(power_metrics, duration): | |||
average_power = sum(x["value"] for x in power_metrics)/len(power_metrics) | |||
energy = average_power * duration | |||
return energy | |||
</syntaxhighlight> | |||
</div> | |||
<br/> | |||
A <code>monitoring_tutorial.png</code> file should be generated and looks like this (on a <code>taurus</code> node): | |||
<span class="mw-customtoggle-4" style="color:#0000ff">Click to expand!</span> | |||
<div class="mw-collapsible mw-collapsed" id="mw-customcollapsible-4"> | |||
<center> | |||
[[File:Monitoring_tutorial.png]] | |||
</center> | |||
</div> | </div> | ||
<br/> | <br/> | ||
If you want to go further, you can enhance the script to implement following features (in increasing order of difficulty): | |||
* | |||
* | * Reserve a node with a GPU and add a case where the matrix multiplication is performed on a GPU (you can use a special “gpu” value in num_threads list). | ||
* | * Using Alumet, add energy consumption measured by RAPL (take care of the RAPL domain returned in metrics, for instance you could only use “PSys” if available to get an approximation of the whole node consumption that can be compared to other values). | ||
* Using Alumet, add GPU consumption using NVML. | |||
<span id="conclusion"></span> | |||
== Conclusion == | |||
The tutorial is now finished. You should have learned most of what you need to know to monitor electrical energy consumption in your Grid’5000 experiments. | |||
If you need additional information about monitoring under Grid’5000 (not specific to power), see the documentation at [[Monitoring_Using_Kwollect]]. Feel free to share suggestions or report any problem at mailto:users@lists.grid5000.fr. | |||
Latest revision as of 17:04, 27 August 2025
| Note | |
|---|---|
This page is actively maintained by the Grid'5000 team. If you encounter problems, please report them (see the Support page). Additionally, as it is a wiki page, you are free to make minor corrections yourself if needed. If you would like to suggest a more fundamental change, please contact the Grid'5000 team. | |
Estimate duration: 90 minutes
Introduction
In this tutorial, you will learn how to monitor electrical energy consumption while experimenting on server-class machines under Grid’5000.
The tutorial will be organized into the following sections:
- Monitoring devices available
- Find monitoring features available on a node
- Getting metrics values from Kwollect
- Monitoring of internal metrics (e.g. RAPL)
- Advanced case: enable high-frequency monitoring on Wattmetres and other on-demand metrics
- Advanced case: find energy consumption for individual power supply
- Practical study
The first four sections explain the basics of energy monitoring under Grid’5000 and should not be skipped. The two “Advanced” sections are optional. The “Practical study” is an exercise to put into practice what you have learned.
Monitoring devices available
Grid’5000 provides access to various monitoring devices that measure the electrical power consumed by nodes, such as:
“Wattmetres” which are specialized devices localized between a node power supply and its power source and able to perform up to 50 measurements per second, with a high relative precision.
The current generation of Wattmetres installed on the infrastructure is made by ADECWatts company.
(Wattmetres are located on the left side of the rack)
PDU (Power Delivery Units), which are the most common way to deliver electrical power to server-class nodes used in Grid’5000, may also export energy monitoring metrics. However, they are less precise than Wattmetres.
(PDU on the left is used to power servers)
BMC (Baseboard Management Controller) are control units placed inside a server chassis, while remaining independent of the rest of the system. They also export energy monitoring metrics, but are even less precise than PDU and thus, Wattmetres (in particular, they are localized downstream from the power supply and therefore cannot take into account its energy losses).


In addition, individual components inside a node may provide energy monitoring. This is typically the case for CPU and GPU, which provide energy consumed by various internal parts by exposing internal hardware counters accessible through a dedicated interface, such as RAPL for Intel & AMD CPUs and NVML for NVIDIA GPUs. See these references for more information: 1 2 3.
⚠️ Warning ⚠️: Monitoring metrics are not always reliable: the monitoring device may fail and report wrong values; PDU and BMC often report inaccurate values (e.g., updated at a low frequency, heavily smoothed, using a moving average, etc.). It is strongly recommended to cross-check your measurements by using different monitoring devices (e.g., both Wattmetres and BMC) to ensure confidence in results.
Find monitoring features available on a node.
Monitoring, like everything else on Grid’5000, is documented in the Grid’5000 Reference API. Let’s see how to query this API to discover what monitoring devices are available for a particular node.
Monitoring capabilities are described in terms of metrics available on a cluster. To get the list of all metrics available for a cluster, the API can be queried at this address:
https://api.grid5000.fr/stable/sites/<SITE>/clusters/<CLUSTER>
For instance, if you are interested in metrics available on taurus-12 node at Lyon, you can query the following URL:
https://api.grid5000.fr/stable/sites/lyon/clusters/taurus
Metrics are described under the metrics entry of the JSON document returned by the command. To get a better view of the metrics list, you can use a command such as:
curl https://api.grid5000.fr/stable/sites/lyon/clusters/taurus | jq '.metrics' | less
As you can see, many metrics are available, related to energy monitoring or not. More information about general monitoring in Grid’5000, including the full list of available metrics, is available in Monitoring Using Kwollect documentation.
We will focus on two metrics for this tutorial: wattmetre_power_watt and bmc_node_power_watt. The Reference API description of these metrics looks like this:
{
 "description": "Power consumption of node reported by Wattmetre, in watt",
 "name": "wattmetre_power_watt",
 "optional_period": 20,
 "period": 1000,
 "source": {
   "protocol": "wattmetre"
 }
},
{
 "description": "Power consumption of node reported by BMC, in watt",
 "name": "bmc_node_power_watt",
 "period": 5000,
 "source": {
   "id": "1.3.6.1.4.1.674.10892.5.4.600.30.1.6.1.{{ 1.3.6.1.4.1.674.10892.5.4.600.30.1.8.1 == System Board Pwr Consumption }}",
   "protocol": "snmp"
 }
}
- The
descriptionfield explains the nature of the monitoring devices, as well as the physical unit of the measure. - The
namefield is the metric’s identifier used throughout the monitoring system. - The
periodfield describes the interval, in milliseconds, between two consecutive measurements performed on the monitoring device. (Note that this does not necessarily correspond to the frequency with which the device itself update its internal value. It can be larger, especially on BMC, as said in the Warning section above). - The
optional_periodfield, only available on thewattmetre_power_wattmetric, indicates that this device can be configured to perform even more frequent measurements every 20 ms (i.e., at 50 Hz), on user’s demand (more on that later). - The
sourcefield indicates the protocol used to query the monitoring device and should not be of much interest to you.
Getting metrics values from Kwollect
Once you have identified the nodes and the metrics you are interested in, you can simply query Kwollect, the monitoring system used in Grid’5000, to retrieve metrics values over time. For instance, to get wattmetre_power_watt and bmc_node_power_watt metrics values for taurus-4 and taurus-5 between 10:00 and 10:10 the 1st of May 2025, you can query the API at:
This will return a JSON document like:
[{"timestamp":"2025-05-01T10:00:00+02:00","device_id":"taurus-5","metric_id":"wattmetre_power_watt","value":6.052631578947369,"labels":{"_device_orig": ["wattmetre1-port4"]}},
 {"timestamp":"2025-05-01T10:00:00+02:00","device_id":"taurus-4","metric_id":"wattmetre_power_watt","value":6.332432432432432,"labels":{"_device_orig": ["wattmetre1-port3"]}},
 {"timestamp":"2025-05-01T10:00:00.654002+02:00","device_id":"taurus-5","metric_id":"bmc_node_power_watt","value":0,"labels":{}},
 {"timestamp":"2025-05-01T10:00:00.654322+02:00","device_id":"taurus-4","metric_id":"bmc_node_power_watt","value":0,"labels":{}},
 {"timestamp":"2025-05-01T10:00:01+02:00","device_id":"taurus-4","metric_id":"wattmetre_power_watt","value":6.070731707317074,"labels":{"_device_orig": ["wattmetre1-port3"]}},
 {"timestamp":"2025-05-01T10:00:01+02:00","device_id":"taurus-5","metric_id":"wattmetre_power_watt","value":6.239024390243902,"labels":{"_device_orig": ["wattmetre1-port4"]}},
...
where each line corresponds to a single measurement.
It is also possible to get all metrics associated to a Grid’5000 reservation by providing OAR job number:
https://api.grid5000.fr/stable/sites/lyon/metrics?job_id=1899135
This will return all metrics from all nodes belonging to the reservation, but you can filter by using the nodes and metrics parameters.
A graphical dashboard is also available to visualize metrics. It is available at:
https://api.grid5000.fr/stable/sites/lyon/metrics/dashboard
You can change lyon with the site you need.
It can be noted that metrics stored in Kwollect are kept indefinitely.
Monitoring of internal metrics
We call “internal metrics” the metrics available from inside the node operating system, i.e., that you can fetch yourself as a user, unlike metrics fetched from external devices, such as Wattmetres, provided by the infrastructure. This kind of metrics includes RAPL for CPU energy consumption, NVML form GPU consumption, but also any kind of metrics available from the system, such CPU or IO usage.
As many tools are available to get internal metrics, we assume that you will want to use the one that’s best fit your needs. We will explain a generic way to push metrics to Kwollect, so it can be adapted whatever the tool used. We will also introduce Alumet usage, a convenient tool to fetch internal metrics which has a “native” Kwollect export feature.
In any case, you will be able to access all your metrics, both internal and external from devices such as Wattmetres and BMC, through the same API using Kwollect.
Pushing metrics to Kwollect
It is possible to push metrics to Kwollect, from inside a node, by performing a POST request to following API endpoint:
https://api.grid5000.fr/stable/sites/SITE/metrics
The request must include the list of metrics to be inserted, formatted as a JSON like:
[{"metric_id": "METRIC_NAME1", "value": VALUE1}, {"metric_id": "METRIC_NAME2", "value": VALUE2}, …]
For each metric, a timestamp value can optionally be provided (otherwise, the current time will be used as the metric’s timestamp). The device_id field can also be given (if it corresponds to a node under reservation by the user making the request), otherwise, the node from which the request originates will be used. Finally, a labels field can be added to provide arbitrary metadata formatted as JSON.
As an example, this little shell script shows how to use this feature from a reserved node. Each second, it will fetch the energy consumed by CPU cores from RAPL using “Linux Perf” tool and push the resulting values to Kwollect:
while true; do
  echo "Fetching power consumption by CPU cores using RAPL"
  V=$(sudo-g5k perf stat -e power/energy-cores/ -x"," sleep 1 2>&1 | grep Joules | cut -d',' -f1)
  echo "Average power during last second: $V W, pushing to Kwollect"
  curl https://api.grid5000.fr/stable/sites/lyon/metrics -X POST -H 'content-type: application/json' -d '{"metric_id": "my_cores_power_watt", "value": '$V'}'
  sleep 1
done
The my_cores_power_watt metric values will be available as usual from Kwollect, e.g., by requesting at:
https://api.grid5000.fr/stable/sites/lyon/metrics?job_id=MY_JOB_ID,metrics=my_cores_power_watt
Using Alumet (Adaptive, Lightweight, Unified Metrics)
Alumet is a versatile monitoring tool that provides a generic measurement pipeline with three steps: poll measurement sources, transform the data, and write the result. It is designed to be able to ingest metrics from various sources without redundant work. Supported sources include RAPL domains, Nvidia’s NVML, and Jetson INA sensors.
Alumet can be configured to monitor internal metrics of a Grid’5000 and export them to Kwollect using the “push feature” described above.
We are going to present an example of this joint use of Alumet and Kwollect for energy monitoring: Alumet is used to monitor RAPL metrics and exports them to Kwollect. Then, you will be able, by querying Kwollect API, to compare measurements from RAPL to external monitoring devices provided by Wattmetres and BMC.
First, Alumet needs to be installed on the reserved Grid’5000 node. Kwolllect support currently requires the latest Git version, to make things easier, the binary is available under Grid’5000 at: http://public.lyon.grid5000.fr/~sdelamare/alumet-agent. You can execute the following commands to get Alumet:
wget http://public.lyon.grid5000.fr/~sdelamare/alumet-agent
chmod +x alumet-agent
Then, we will use a alumet-config.toml configuration file to setup the rapl input plugin and the kwollect-output plugin with the following content:
[plugins.rapl]
poll_interval = "1s"
flush_interval = "5s"
no_perf_events = false

[plugins.kwollect-output]
url = "https://api.grid5000.fr/stable/sites/SITE/metrics"
append_unit_to_metric_name = true
use_unit_display_name = false
Remind replacing SITE in the URL entry by the site where your reserved node is located.
To access to RAPL metrics, we need a privileged configuration that must be setup using:
sudo-g5k
sudo sysctl -w kernel.perf_event_paranoid=0
Finally, run Alumet with:
./alumet-agent --config alumet-config.toml --plugins rapl,kwollect-output run
As specified in the configuration file, this will fetch RAPL metrics every second and push them to Kwollect.
The name of the RAPL metrics used by Alumet is “rapl_consumed_energy_J” (RAPL indeed performs energy measurements and the units used are Joules). You can look at these metrics by querying:
(replace lyon, taurus-11 by what is appropriate for you. If start_time is omitted, the metrics from last 5 minutes will be returned).
A single metric looks like this:
{
  "timestamp": "2025-07-03T12:19:59.846832+02:00",
  "device_id": "taurus-11",
  "metric_id": "rapl_consumed_energy_J",
  "value": 0.87835693359375,
  "labels": {
    "domain": "pp0",
    "consumer_id": "",
    "_insert_user": "sdelamare",
    "ressource_id": "0",
    "__insert_time": 1751538003.850289,
    "consumer_kind": "local_machine",
    "ressource_kind": "cpu_package"
  }
}
Pay attention to labels content. It provides information about the specific RAPL domain associated to this particular measurement. In this case, the "domain": "pp0" entry means that this measure is the energy consumed by CPU’s cores and "ressource_id": "0" means that it only applies to the first CPU of the node.
Finally, to get metrics from both external monitoring devices and RAPL, you can perform a query such as:
But take care when comparing measures from RAPL and from Wattmetre or BMC: - RAPL measurements only concern a specific component of the system (CPU, DRAM, etc.), except for the “PSys” domain, which should encompass the whole system but which is loosely specified and only available on some recent hardware - The measurements from Wattmetres and BMC are power measurements, representing an average power usage over a period of time (one second by default for Wattmetres). The RAPL measurement reported by Alumet represents the total energy consumption during the period of time between the previous measurement and the current one. Remember that one Joule of energy is corresponding to a power usage of one Watt during one second.
It can be noted that Alumet provides other modules to get consumption from GPU using NVML or from NVIDIA Jetson, and for other kind of metrics (CPU usage…)
Advanced case: Enable high-frequency monitoring on Wattmetres and others on-demand metrics
Some metrics are not monitored by default, or at a lower frequency. Let’s go back to the metrics description in the Reference API:
curl https://api.grid5000.fr/stable/sites/lyon/clusters/taurus | jq '.metrics' | less
{
 "description": "Power consumption of node reported by Wattmetre, in watt",
 "name": "wattmetre_power_watt",
 "optional_period": 20,
 "period": 1000,
 "source": {
   "protocol": "wattmetre"
 }
},
{
 "description": "Power consumption of node reported by BMC, in watt",
 "name": "bmc_node_power_watt",
 "period": 5000,
 "source": {
   "id": "1.3.6.1.4.1.674.10892.5.4.600.30.1.6.1.{{ 1.3.6.1.4.1.674.10892.5.4.600.30.1.8.1 == System Board Pwr Consumption }}",
   "protocol": "snmp"
 }
},
{
  "description": "Voltage of PSU 1 reported by BMC, in volt",
  "labels": {
    "psu": "1"
  },
  "name": "bmc_psu_voltage_volt",
  "optional_period": 5000,
  "period": 0,
  "source": {
    "id": "1.3.6.1.4.1.674.10892.5.4.600.12.1.16.1.1",
    "protocol": "snmp"
  }
},
{
  "description": "Current of PSU 1 reported by BMC, in amp",
  "labels": {
    "psu": "1"
  },
  "name": "bmc_psu_current_amp",
  "optional_period": 5000,
  "period": 0,
  "scale_factor": 0.1,
  "source": {
    "id": "1.3.6.1.4.1.674.10892.5.4.600.30.1.6.1.{{ 1.3.6.1.4.1.674.10892.5.4.600.30.1.8.1 == PS1 Current 1 }}",
    "protocol": "snmp"
  }
},
The presence of an optional_period field indicates that the associated metrics can be activated “on demand”. For the wattmetre_power_watt metric, the period field is 1000 meaning that by default the Wattmetre gets a measure every second. However, as the optional_period is 20, measurements are performed every 20 milliseconds when the metric is “on-demand” activated. Metrics having a period of 0, such as bmc_psu_current_amp, don’t perform any measurement by default. It needs to be activated to perform measurements every optional_period milliseconds (i.e., every 5 seconds in the case of bmc_psu_current_amp metric).
Enabling on_demand metrics must be done at reservation time, by providing -t monitor=xxxx option to oarsub. For instance, to enable wattmetre_power_watt high frequency monitoring:
oarsub -r now -p taurus -t monitor='wattmetre_power_watt'
To enable monitoring of bmc_psu_current_amp:
oarsub -r now -p taurus -t monitor='bmc_psu_current_amp'
The -t monitor option accepts regular expressions matching metrics name. For example, you can enable all “on-demand” metrics using:
oarsub -r now -p taurus -t monitor='.*'
If you look at metrics at
https://api.grid5000.fr/stable/sites/lyon/metrics?job_id=MY_JOB_ID
you will see more metrics than before, especially from Wattmetres.
Advanced case: find energy consumption for individual power supply
Most Grid’5000 nodes have several PSU to power them and several monitoring devices -one per PSU- are needed to monitor the power used by the entire node. They are some situations where you need to get metrics associated with each PSU separately and process them yourself. The two most common situations are:
- Get power consumption from PDU: when Wattmetres are used, measurements on each Wattmetre are summed-up to provide the wattmetre_power_watt metric available on the node. But this automatic sum cannot be done for PDUs power values and metrics must be retrieved from each PDU delivering power to node PSUs.
- Get power consumption for nodes sharing the same blade: Some Grid’5000 nodes are physically organized in groups of 2 or 4 that share the same server frame or blade. PSUs belong to the blade and are therefore shared by the nodes grouped in the same blade. It would make no sense to provide a power consumption metric associated with a single node from these shared PSUs.
In such cases, where monitoring of PSUs is available but no meaningful power consumption metric can be associated with an individual node, it may be still interesting to get metrics associated with each PSU separately and process them yourself.
For instance, chuc cluster at Lille is composed of blades with two nodes each. Thus, chuc-1 and chuc-2 share the same PSUs, as well as chuc-3 and chuc-4, etc.
To retrieve the Wattmetres connected to these PDUs, it is possible to query the reference API for the specific node your interested in. For example, for chuc-3:
https://api.grid5000.fr/stable/sites/lille/clusters/chuc/nodes/chuc-3
Under the pdu entry, you will find 6 “wattmetre” entries, meaning that chuc-3 uses 6 PSUs monitored by Wattmetres. For each Wattmetre, the uid and port inform you about the Wattmetre device identifier that monitors each PSU.
"pdu": [
(...)
{
  "kind": "wattmetre-only",
  "port": 12,
  "uid": "wattmetrev3-1"
},
{
  "kind": "wattmetre-only",
  "port": 13,
  "uid": "wattmetrev3-1"
},
{
  "kind": "wattmetre-only",
  "port": 14,
  "uid": "wattmetrev3-1"
},
{
  "kind": "wattmetre-only",
  "port": 15,
  "uid": "wattmetrev3-1"
},
{
  "kind": "wattmetre-only",
  "port": 16,
  "uid": "wattmetrev3-1"
},
{
  "kind": "wattmetre-only",
  "port": 17,
  "uid": "wattmetrev3-1"
}
]
You can check that chuc-4 has exactly the same identifiers at:
https://api.grid5000.fr/stable/sites/lille/clusters/chuc/nodes/chuc-4
which means that Wattmetres (and PSUs) are shared between these two nodes.
Finally, you can retrieve values for all Wattmetres attached to chuc-3 and chuc-4 PSUs by querying the Wattemetre identifier they are connected to. For instance, the first Wattmetre has a port equals to 12 and its uid is wattmetrev3-1. This means that the corresponding Wattmetre identifier is wattmetrev3-1-port12.
It is thus possible to retrieve the power consumption of every PSUs of chuc-3 and chuc-4 blade using a query that looks like:
The devices parameter has the same effect as nodes parameter seen before.
Practical study
We now invite you to do a practical exercise to apply what you’ve learned. It consists in a study of the energy cost of a matrix multiplication made with Pytorch.
Reserve a node on Grid’5000 and execute the following commands to set up your environment:
python -m venv monitoring_venv
source monitoring_venv/bin/activate
module load cuda
pip3 install torch requests matplotlib
export REQUESTS_CA_BUNDLE=/etc/ssl/certs/ca-certificates.crt
Copy / paste this code snippet into a monitoring_tutorial.py.
Click to expand!
import torch
import time
import socket
import requests
import matplotlib.pyplot as plt


def main():
    results = {}
    num_threads = [1, 2, 4, 8, 16, 32]

    for c in num_threads:
        start_time, end_time, duration, _ = perform_matrix_multiplication(num_threads=c)

        results[c] = {}
        results[c]["duration"] = duration

        values = get_metrics_from_kwollect(start_time=start_time, end_time=end_time, metric="wattmetre_power_watt")
        results[c]["energy_wattmetre"] = get_energy_from_metrics(values, duration)

        values = get_metrics_from_kwollect(start_time=start_time, end_time=end_time, metric="bmc_node_power_watt")
        results[c]["energy_bmc"] = get_energy_from_metrics(values, duration)

    plot_results(results, "monitoring_tutorial.png")


def perform_matrix_multiplication(num_threads=None):
    if num_threads is not None:
        num_threads_init = torch.get_num_threads()
        torch.set_num_threads(num_threads)
    N=2048
    A = torch.randn(N, N, device="cpu")
    B = torch.randn(N, N, device="cpu")
    count = 0
    start_time = time.time()
    while time.time() - start_time < 10:
        C = A @ B
        count += 1
    end_time = time.time()
    duration = (end_time - start_time)/count
    print(f"Matrix multiplaction duration: {duration} seconds ({count} multiplications performed)")
    if num_threads is not None:
        torch.set_num_threads(num_threads_init)
    return start_time, end_time, duration, count


def plot_results(results, outfile):
    num_threads = sorted(results.keys())
    fig, ax1 = plt.subplots(figsize=(8, 8))
    ax1.set_title("Matrix Multiplication Duration & Energy")
    ax1.set_xlabel("Number of threads used")

    ax1.set_ylabel("Duration (seconds)", color="orange")
    ax1.bar(num_threads, [results[c]["duration"] for c in num_threads], color="orange")

    ax2 = ax1.twinx()
    ax2.set_ylabel("Energy (joules)")
    ax2.plot(num_threads, [results[c]["energy_wattmetre"] for c in num_threads], "+-", color="green", label="wattmetre")
    ax2.plot(num_threads, [results[c]["energy_bmc"] for c in num_threads], "+-", color="blue", label="BMC")
    ax2.legend()

    plt.savefig(outfile)


def get_metrics_from_kwollect(start_time, end_time, metric, site=None, node=None):
    if node is None:
        node = socket.getfqdn().split(".")[0]
    if site is None:
        site = socket.getfqdn().split(".")[1]

    kwollect_url = f"https://api.grid5000.fr/stable/sites/{site}/..." #FIXME
    print(f"Requesting Kwollect at {kwollect_url}")
    metrics = requests.get(kwollect_url).json()

    return metrics

def get_energy_from_metrics(power_metrics, duration):
    average_power = sum(-1)/len([-1]) #FIXME
    energy = average_power * 0 #FIXME
    return energy


if __name__ == "__main__":
    main()
The goal of the script is to measure duration and energy consumed when performing matrix multiplications while using a different number of threads. The script is composed as follows:
- The
main()function implements the script logic: looping over a number of threads, perform the matrix multiplication, get metrics from Kwollect and finally plot the results under “monitoring_tutorial.png” file. - The
perform_matrix_multiplication(num_threads)function implements the matrix multiplication - The
plot_results(results, outfile)function implements plotting of the results - The
get_metrics_from_kwollect(start_time, end_time, metric, site=None, node=None)is used to fetch the values formetricbetweenstart_timeandstop_timeperiod. (ifnodeandsiteparameters are not provided, they will be derived from the machine where the script is executed) - The
get_energy_from_metrics(power_metrics, duration)will compute the energy consumed underdurationfrompower_metricsreceived from Kwollect
The latter two functions are incomplete. You must replace lines containing “FIXME” comments with the appropriate code to make the function work as expected.
Once done, you can transfer the “monitoring_tutorial.png” file to your local machine to visualize it. You should be able to answer questions such as:
- How many cores you should use to get the fastest matrix multiplication?
- Is it more energy efficient to use less cores to consume less energy?
- …
Solution
Below are the completed functions that implement this exercise:
Click to expand!
def get_metrics_from_kwollect(start_time, end_time, metric, site=None, node=None):
    if node is None:
        node = socket.getfqdn().split(".")[0]
    if site is None:
        site = socket.getfqdn().split(".")[1]

    kwollect_url = f"https://api.grid5000.fr/stable/sites/{site}/metrics?nodes={node}&start_time={start_time}&end_time={end_time}&metrics={metric}"
    print(f"Requesting Kwollect at {kwollect_url}")
    metrics = requests.get(kwollect_url).json()

    return metrics

def get_energy_from_metrics(power_metrics, duration):
    average_power = sum(x["value"] for x in power_metrics)/len(power_metrics)
    energy = average_power * duration
    return energy
A monitoring_tutorial.png file should be generated and looks like this (on a taurus node):
Click to expand!

If you want to go further, you can enhance the script to implement following features (in increasing order of difficulty):
- Reserve a node with a GPU and add a case where the matrix multiplication is performed on a GPU (you can use a special “gpu” value in num_threads list).
- Using Alumet, add energy consumption measured by RAPL (take care of the RAPL domain returned in metrics, for instance you could only use “PSys” if available to get an approximation of the whole node consumption that can be compared to other values).
- Using Alumet, add GPU consumption using NVML.
Conclusion
The tutorial is now finished. You should have learned most of what you need to know to monitor electrical energy consumption in your Grid’5000 experiments.
If you need additional information about monitoring under Grid’5000 (not specific to power), see the documentation at Monitoring_Using_Kwollect. Feel free to share suggestions or report any problem at mailto:users@lists.grid5000.fr.